


17 Employer Branding Metrics HR Should Track [2025 Edition]
Your employer brand is what people say when asked, “What do you think it’s like to work for that company?” It’s a simple question, but the answers—and people’s perceptions—can vary a lot. Now try influencing that perception, or better yet, measuring it.

Building an employer brand without tracking relevant employer branding metrics is like baking a cake without watching the clock: a waste of time and energy with a significant risk of things going wrong.
This article explores 17 employer branding metrics for HR professionals to consider when building (and tracking) their employer brand.
Contents
What are employer branding metrics?
How to measure employer branding

What are employer branding metrics?
Employer branding metrics are the data points organizations and HR use to evaluate the performance of their employer branding efforts and activities.
Making the most of your employer brand requires consistent monitoring, measurement, and refinement. Branding metrics provide HR teams with a clear way to track results, justify investments, and improve their employer branding strategy.
How to measure employer branding
There’s no single metric that can capture the full impact of employer branding, and no one-size-fits-all set that works for every organization either.
Instead, the key is to find the right mix of metrics that fit your strategy and goals. That tailored approach will give you insight into how your employer brand is performing and where it needs work.
Here are 17 employer branding metrics worth tracking:
1. Candidate NPS
Candidate net promoter score (NPS) results indicate candidates’ experience with your organization and how likely they are to recommend applying for positions at your company. The score also gives you valuable insight into how candidates perceive your employer brand.
Candidate NPS is calculated by asking one question, typically something like:
“On a scale of 0 to 10, how likely are you to recommend applying to [Company Name] to a friend or colleague?”
Respondents are then grouped according to the numbers.
- Promoters (9–10): Highly satisfied candidates who would enthusiastically recommend you.
- Passives (7–8): Candidates who are neutral or satisfied, but not enthusiastic enough to promote you.
- Detractors (0–6): Candidates who had a negative experience and may discourage others from joining you.
To calculate candidate NPS:
(Number of promoters – Number of detractors) / (Total number of respondents) x 100
This results in a score ranging from -100 to +100.
- Any positive score is good
- A score between 30 and 70 is great
- Anything higher than 70 is considered excellent.
Measuring your candidate NPS gives you a snapshot of candidate sentiment about your company. It also provides a reference point for comparison after fine-tuning your recruiting methods. A score that increases with each new NPS calculated can also indicate more positive views of your employer brand.
Master data-driven employer branding strategies
Learn how to track and analyze key employer branding metrics to refine your messaging, enhance candidate experience, and showcase your impact to leadership.
In AIHR’s HR Metrics & Dashboarding Certificate Program, you’ll build the skills to collect, visualize, and interpret data that connects your employer brand to real business outcomes, and turn employer branding insights into action with clear, evidence-based reporting.
2. Brand search volume
How often are people searching for your company in the context of job openings, employee testimonials, or careers? Tracking this information can help you measure the impact of your employer branding activities.
For example, a spike in searches such as “[Company name] jobs,” [Company name] careers” or “What’s it like to work at [Company name]?” after you’ve been running branding campaigns can signal increased interest in your organization as an employer.
Use SEO tools like Google Search Console, SEMrush, Ahrefs, or Google Trends to monitor how often your brand is being searched alongside career-related keywords. Set up filters to track monthly trends and compare results before and after specific campaigns or events (e.g., a LinkedIn content push or new recruitment campaign).
3. Employee referral rate
The employee referral rate shows how often current employees recommend people in their network for open roles at your company.
Employees typically only recommend a position at their company when they are happy with the work environment and the organization. They may also believe the potential hire is qualified to be a strong contributor and uphold the company culture. A good fit will lead to higher employee retention rates.
To calculate your employee referral rate:
(Number of hires from employee referrals / Total number of hires) x 100
For example, if 15 out of 60 new hires were employee referrals, your referral rate is 25%.
Beyond being a vote of confidence, referrals can also simplify and speed up the recruiting process. According to Glassdoor, employee referrals result in more accepted offers. LinkedIn data backs this up, too, showing that candidates are three times more likely to trust employees over the company itself when evaluating what it’s like to work somewhere.
By analyzing your employee referral program data, you can understand whether employees are willing to advocate for you. High referrals of suitable candidates and a high number of accepted job offers indicate your employer brand is working internally and externally.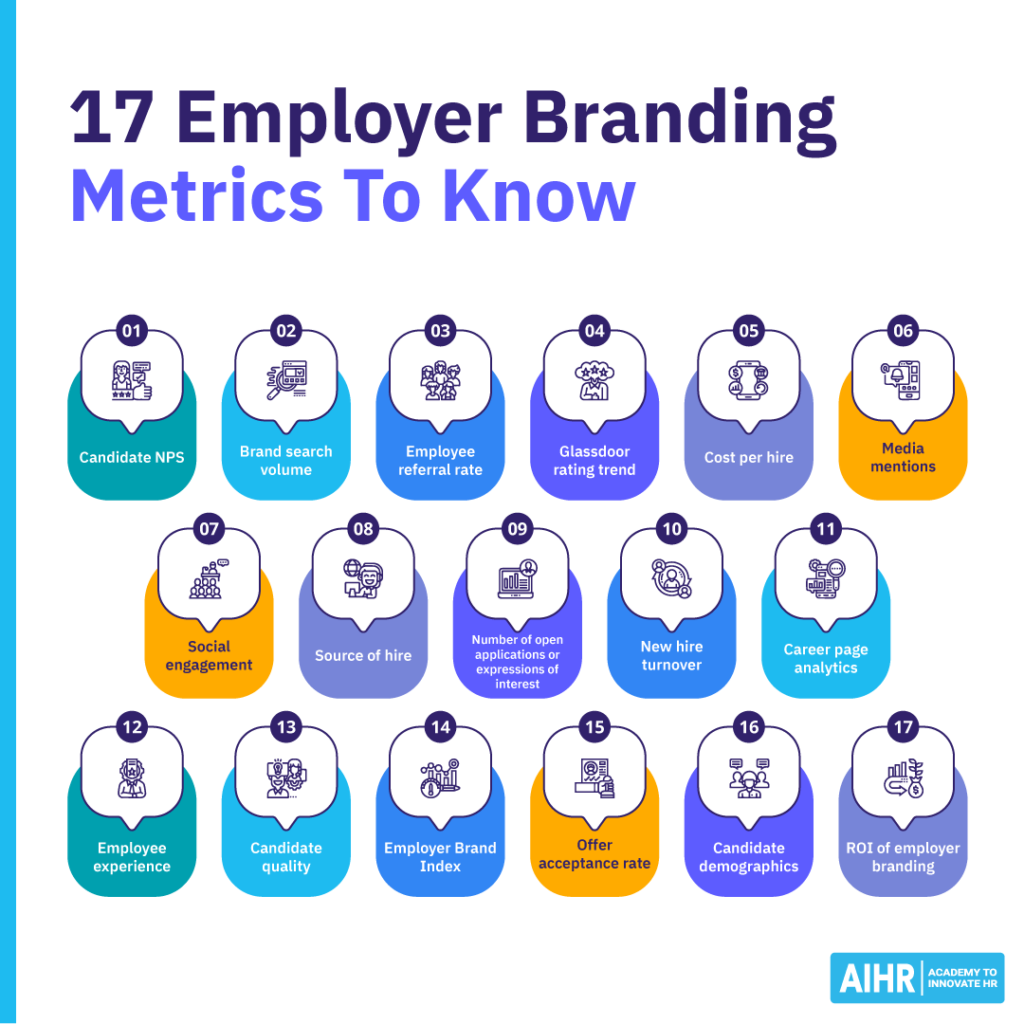
4. Glassdoor rating trend
Job seekers worldwide use job board sites like Glassdoor to learn about open positions and research what others say about working for different employers.
These ratings are among the first things job seekers check. A consistently positive score enhances your credibility, while negative reviews, especially if recent, can deter great candidates. The trend also shows whether your employer branding efforts are resonating internally.
You should monitor:
- Overall company rating (scale of 1–5)
- CEO approval rating
- Interview experience scores
- Recency and content of reviews
- Common themes in pros and cons.
Tools like Glassdoor’s employer center or reputation management platforms can help aggregate and analyze this data over time.
HR tip
Don’t just chase a higher rating—focus on understanding what employees are saying and where you can improve. If you do encourage reviews, be transparent and avoid pressuring employees for positive comments. Authentic feedback is more valuable for long-term trust.
5. Cost per hire
Cost per hire (CPH) captures the total expense of filling a position, factoring in everything from job ads and recruiter fees to time spent by hiring teams. It’s a core recruitment metric that also offers insights into how your employer brand may influence hiring efficiency.
A strong employer brand can lower your cost per hire because candidates who are already familiar with your company are more likely to apply on their own, move through the process more efficiently, and accept offers faster.
According to Harvard Business Review, companies with a poor reputation need to offer a 10% higher salary than companies with a strong employer brand. LinkedIn also found that organizations with a strong employer brand can reduce cost per hire by up to 50% and fill roles up to twice as fast.
6. Media mentions
How often is your company mentioned in the media as an employer? Think of media mentions of popular workplace topics, such as culture, benefits, recognition, diversity, or engagement.
Positive (social) media exposure can boost your reputation as an employer and build trust with potential candidates even before they engage with your organization directly.
You could monitor:
- Feature articles in HR or business publications
- Mentions in “top employer” lists
- Social media coverage by influencers
- Podcasts or YouTube features discussing your workplace.
Depending on your target candidate audience(s), you should identify various relevant media outlets and track whether or not they mention your company as an employer as a result of your branding activities.
7. Social engagement
Social engagement refers to how your employer brand content performs across platforms like LinkedIn, Instagram, TikTok, and others. It includes likes, comments, shares, clicks, and new followers.
According to research, 52% of candidates check out a company’s social media accounts and sites to learn more about an employer. Organizations can leverage social media platforms to reach candidates and provide a positive impression of why they consider them a favored employer.
A strong social media presence also expands your reach and increases exposure to your employer brand. You can track the number of likes, shares, comments, and followers to measure whether your employer brand exposure is growing and appealing to the market. Positive or negative engagement with your content provides an understanding of how followers view your brand.
8. Source of hire
Source of hire (SoH) is a recruitment metric that allows HR teams to identify where successful candidates were sourced. This includes common channels like job boards, social media, employee referrals, and career pages, as well as an organization’s employer branding activities on these and other channels.
There are different ways to measure SoH, depending on what channels and technology you use, including:
- ATS data (most accurate if candidates are required to select a source)
- UTM parameters on job links
- Recruiter insights
- Candidate surveys during application or onboarding.
Let’s look at an example. Your organization hired 10 new salespeople during the first quarter of 2025, and the source of hire looks like this:
- Employee referrals: Four hires
- Social media: Two hires
- Career page: Two hires
- Job boards: Two hires
The SoH calculation in this example is as follows:
- Employee referrals: (4/10 hires) x 100 = 40%
- Social media: (2/10 hires) x 100 = 20%
- Career page: (2/10) x 100 = 20%
- Job boards: (2/10) x 100 = 20%
In other words, 40% of this company’s new hires came from employee referrals, 20% via social media, etc.
9. Number of open applications or expressions of interest
Candidates come to you when your company has a strong employer brand. Positioning your company as a desirable employer will increase open applications and expressions of interest.
Monitor the number of interested job seekers reaching out and track whether this number increases or declines over time. This will provide insight into whether your employer branding efforts resonate with job seekers.
10. New hire turnover
New hire turnover refers to the percentage of employees who leave the organization within a short period, typically the first year of employment.
A high turnover rate among new hires may indicate a disconnect between how the organization is portrayed and what it’s actually like to work there. If your branding sets unrealistic expectations, candidates may accept offers but leave once reality sets in.
There are two often-used ways to calculate new hire turnover:
- As a percentage of all new hires:
(Number of new hires who left within the defined period / Total number of new hires) × 100
- As a portion of total turnover:
(New hire exits / Total employee exits) × 100
Use this metric to validate how accurately your employer brand reflects the actual experience. If your branding promises work-life balance, flexibility, or a fast-paced environment, but new hires leave because expectations don’t match reality, it’s time to reassess your messaging.
11. Career page analytics
Your careers page is not just a place to list vacancies; it also provides the perfect opportunity to promote brand awareness by showcasing your company values, work environment, and employee benefits.
Understanding visitor behavior on your careers page will help you target your employer branding efforts. You can gather statistics from site traffic, such as:
- Page views and sessions: How much traffic your page gets.
- Traffic sources: Where visitors are coming from (e.g., social, job boards, search).
- Time on page: Indicates engagement and whether visitors are reading your content.
- Bounce rate: If people leave after viewing only one page, your messaging or navigation might need work.
- Application start and completion rates: Are visitors following through?
- Drop-off rates: Shows how many abandon the application before submitting.
12. Employee experience
Employee experience (EX) reflects how people feel about working at your company, from onboarding to career development to daily culture. It’s the lived reality behind your employer brand promise.
Your employer brand is essentially your employee experience, but viewed from the outside. If there’s a big gap between what your brand claims and what employees actually experience, it erodes trust, both internally and externally.
An obvious way to measure EX is through data gathered via employee engagement surveys, stay interviews, and exit interviews. If (many) employees feel their EX is different from what you ‘sold’ them with your employer branding, you will need to make some changes.
13. Candidate quality
Candidate quality tracks how well-suited applicants are for your open roles. This includes both their fit for the job and how well they align with your company culture and values.
Here are some metrics to use in measuring the quality of your candidates:
- How many candidates apply via referral
- The number of candidates selected to be interviewed compared to the total number of candidates
- Number of interviews versus the number of employment offers
- Job performance and retention rate of new hires.
Note: An applicant-to-interview ratio above 12% may indicate you are attracting qualified applicants. If your ratio is below 12%, focus on improving your employer brand.
14. Employer Brand Index
The Employer Brand Index (EBI) provides you with a bottom-up view of what your employees — current or past and future — are saying about your company.
The method, developed by Link Humans, measures 16 employer brand attributes. Data is collected over three to 12 months from multiple social media channels, online forums, and employer review sites, and is measured against the 16 brand attributes. You can then measure your performance across these areas and track your improvement over time.
EBI fast fact
In 2024, Nike had the highest Employer Branding Index (EBI) (PDF) of all companies in the U.S. (93.1). The company was followed closely by PepsiCo at 93 and Apple at 88.9.
15. Offer acceptance rate
Offer acceptance rate (OAR) tells you how many candidates accept your job offers compared to how many you extend. A high OAR indicates the effectiveness of your recruitment practices and is a good indicator of whether your employer brand resonates with potential hires.
Start tracking your offer acceptance rate so that when you take steps to improve your employer brand, you can also measure your efforts against this metric.
Additionally, collect feedback from candidates who turn down the opportunity to work for your organization to understand why. You’ll be able to learn whether people have unrelated reasons for rejecting the offers or if there is a prevailing negative perception about your company.
16. Candidate demographics
Building a diverse workforce starts with attracting diverse applicants. Are you reaching people from diverse backgrounds? If so, it signals that your employer brand communicates an inclusive atmosphere that will attract different people.
One way to measure this is by conducting anonymous candidate surveys to collect data on your candidates’ gender, race, and ethnicity. If your candidate demographics consistently reflect the same pool of applicants, it may be time to broaden your employer branding efforts. Seek out any subtle bias in your messaging and then weave in different perspectives. This can help you access the untapped talent you’re missing out on.
17. ROI of employer branding
Employer branding plays a key role in attracting top talent, but showing its value to senior leadership often requires more than a gut feeling. That’s where ROI (return on investment) comes in. It helps you quantify the impact of your employer branding efforts, justify the budget, and make the case for continued investment.
Here is how to calculate it:
ROI = (Financial value generated – Total branding costs) / Total branding costs × 100
For example, if you spent $50,000 on a branding initiative and saved $75,000 through faster hiring, reduced reliance on agencies, and better retention, your ROI would be:
(75,000−50,000) ÷ 50,000 × 100 = 50
Keep in mind that calculating ROI isn’t always straightforward. It can be difficult to directly attribute cost savings to branding alone, especially when multiple initiatives are happening at once. That’s why it’s helpful to look at ROI as part of a broader picture using other supporting metrics, like offer acceptance rates, referral volume, or applicant quality.
Also, how you calculate ROI should reflect your specific hiring goals. For example, if you only recruit a handful of people each year, metrics like increased applicant volume may be less relevant than improvements in retention or quality of hire.
Over to you
Whether you’re building a new employer brand or refining an existing one, tracking the right metrics is essential. These 17 measurements give you both breadth and depth, from top-of-funnel visibility and engagement to deeper indicators like retention, referral behavior, and internal alignment.
Pick the ones that align with your goals, and use them to continuously improve how your company is seen, felt, and experienced by current and future talent.


Learn more
Related articles


Are you ready for the future of HR?
Learn modern and relevant HR skills, online
