


HR Analytics Maturity Model: Test & Improve Your Level
Six times more revenue. That’s how much organizations with high analytics maturity generate over ten years compared to those at a lower level. Progressing your HR analytics maturity level can help your team make more informed decisions that drive long-term business success.
The higher your HR analytics maturity level, the better positioned you are to use the data you collect to deliver business outcomes. Knowing where your organization currently sits on the analytics maturity model gives you a clear understanding of the improvements you need to make to reach the next level.
A survey by SD Worx found that although 3 in 4 organizations claim to have a high analytics maturity level, 44% of organizations believe they lack the expertise required to deliver staff reports and insights. This demonstrates a mismatch between where businesses believe they are and where they are in reality.
In this article, we’ll explore the HR analytics maturity model, how to conduct an HR analytics maturity assessment to determine your current maturity level, and how to increase HR analytics maturity in your organization based on the business’s unique needs and goals.
Contents
HR analytics maturity model explained
Why HR analytics maturity matters
HR analytics maturity assessment
How to increase HR analytics maturity in your organization

HR analytics maturity model explained
The HR analytics Maturity model defined by Bersin/Deloitte consists of 4 stages:
- Operational reporting
- Advanced reporting
- Advanced analytics
- Predictive analytics.
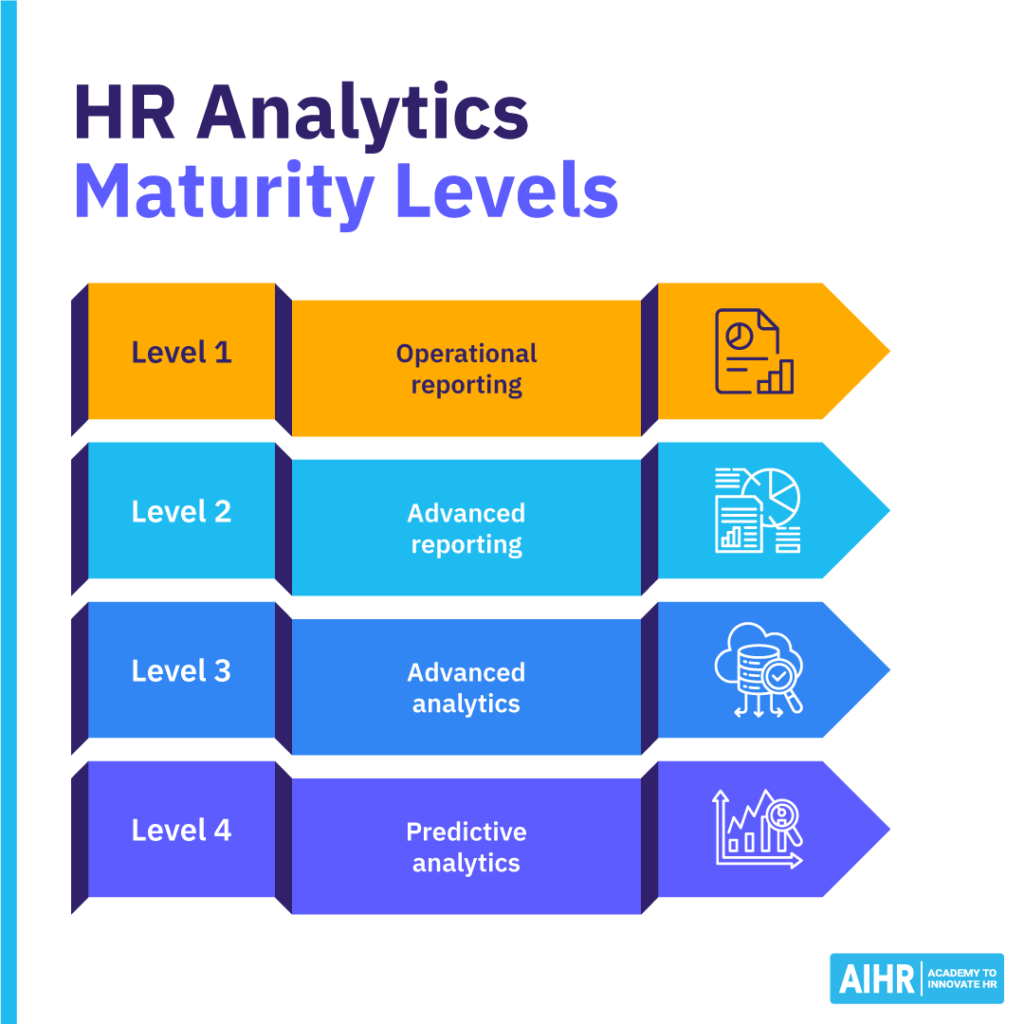
Let’s explore the four levels in more detail.
Level 1: Operational reporting
At level 1, the HR department works with ‘traditional’ operational reporting, using available data to understand what happened in the past—and potentially why—and what this means for the business. The HR team reports traditional metrics such as headcount, attrition, labor cost, and training cost, usually generated using a Human Resources Information System (HRIS).
Level 2: Advanced reporting
HR departments at level 2 are capable of operational and advanced reporting of HR metrics. This proactive reporting provides frequent, multiple perspectives and is sufficiently advanced to influence strategic decision-making. HR reporting is descriptive and focused on efficiency. Most organizations at level 2 deliver HR metrics to managers and executives in organized dashboards.
Level 3: Advanced analytics
At level 3 of the data and analytics maturity model, the organization has surpassed operational and proactive reporting and has succeeded in introducing more thorough, advanced analytics. Statistical modeling is used to solve business problems and predict the future.
Level 4: Predictive analytics
At level 4 – the highest level of analytics maturity – the HR team plays a major role in the organization’s strategic decision-making. It’s gathering data, using it to predict what could happen in the future, and to plan for it. HR is aware of the impact of people policies, actively uses predictive models, and is capable of playing a fully strategic role within the company.
Organizations that have reached level 4 in the people analytics maturity model are, therefore, more likely to have a Chief Human Resources Officer (CHRO) on their Board of Directors or a people analytics center of excellence that directly reports to the CEO.
HR analytics maturity tends to mirror the broader HR function’s maturity, but can lag behind or advance ahead depending on the organization’s focus and investment. For example, early-stage HR functions tend to be in the reporting stage, where metrics like headcount and turnover are tracked, while more advanced HR functions move into predictive analytics.
That said, the two don’t always progress in sync. A company might have a relatively mature HR function with consistent processes, strong leadership support, and strategic alignment, but still rely on spreadsheets for tracking data. In this case, HR is ready to use insights but lacks the tools or skills to move beyond descriptive metrics.
Sometimes, an organization has strong data capabilities (e.g., a central analytics team or investments in BI tools), but the HR function itself isn’t fully developed—processes are inconsistent, or decision-making is still mostly reactive. The analytics may be capable of producing predictive models, but without a solid HR foundation, the data inputs are unreliable, or the insights aren’t used.
In short, the development of one often influences the other, but mismatches do happen. Companies get the most value when HR practices and analytics capabilities evolve together.
Why HR analytics maturity matters
Understanding where your organization sits on the HR analytics maturity curve can have a positive impact on all areas of the business.
- Enhancing employee experience: A data-driven approach and advanced HR analytics can help you spot engagement trends and predict turnover risks, which enables HR teams to take proactive measures to improve the employee experience and retain top talent.
- Driving business performance: When workforce strategies align with the business’s long-term goals, it helps ensure the right people are in the right roles at the right time. This facilitates more efficient operations, which saves the organization money and drives revenue.
- Improving risk management: Through analyzing workforce trends, organizations are able to predict future skill and talent gaps and tackle issues before they escalate. With a mature analytics function, organizations can minimize risk and maintain a strong workforce.
- Fostering a data-driven culture: As organizations progress through the stages of the HR analytics maturity model, data and analytics become a core part of daily operations and decision-making. This drives innovation, gives companies a competitive edge, and cements HR as a strategic business partner that facilitates organizational growth.
Reaching the next level of HR analytics maturity takes an HR team that works confidently with data, turns insights into strategic actions, and supports evidence-based decisions across the business.
With AIHR for Business, you can upskill your HR team in data literacy, reporting, dashboarding, and using analytics tools, building the capabilities needed to operate as a high-impact, data-driven HR function.
HR analytics maturity assessment
It’s essential to know where you are today to achieve the next stage of maturity. The HR analytics maturity self-assessment (pictured below) can help you identify the current maturity level of your organization.
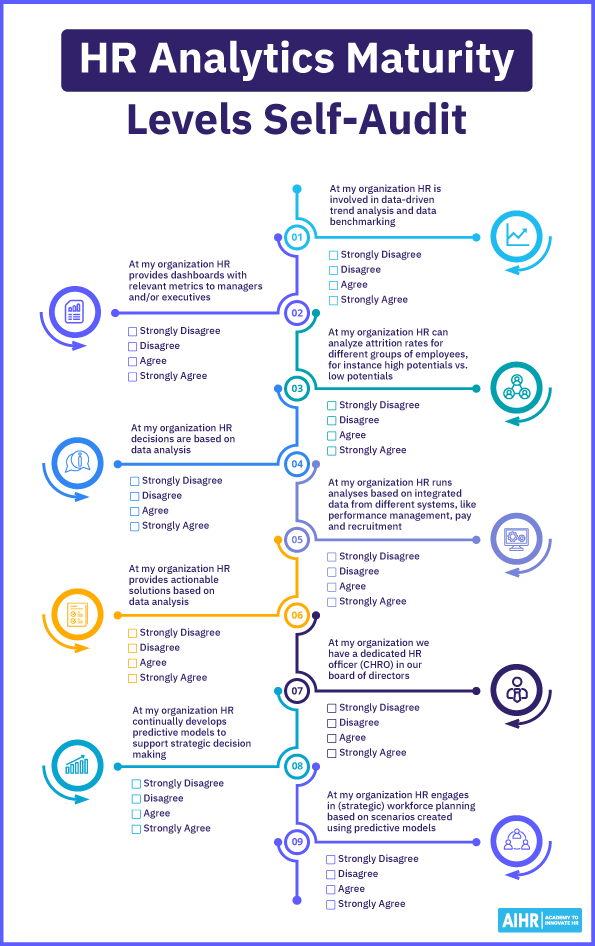
For each statement, decide whether you strongly disagree, disagree, agree, or strongly agree.
Each answer gives you the following points:
- Strongly disagree: 0 points
- Disagree: 1 point
- Agree: 2 points
- Strongly agree: 3 points
Once you’ve completed your answers to all the statements, add your points. Your total provides an estimation of your organization’s analytics maturity level.
- 0-5 points: Level 1 – Operational reporting
- 6-11 points: Level 2 – Advanced reporting
- 12-18 points: Level 3 – Advanced analytics
- 19+ points: Level 4 – Predictive analytics.
Go on to read how to progress from your level to the next below.
Extra tips for conducting an HR analytics maturity assessment
- Review current analytics output: Look at the reports and dashboards you’re already producing. Are they mostly descriptive (e.g., headcount, turnover rates), or are you starting to forecast trends and model outcomes? The type and depth of your output say a lot about your current maturity level.
- Gather stakeholder feedback: Talk to HR team members, business leaders, and department managers. Ask how they use HR data, what’s missing, and whether current insights help them make decisions. Their input can reveal blind spots and opportunities.
- Bring in external help: Consultants, analytics trainers, or software vendors can help you benchmark against best practices, uncover gaps, and recommend next steps. This is especially useful if you’re stuck or not sure how to progress to the next stage.
How to increase HR analytics maturity in your organization
Let’s explore how you can progress from one stage of the HR analytics maturity model to the next.
Getting to Level 1: How to establish operational reporting
This is for businesses just starting their analytics journey who want to establish a strong level 1 foundation. The HR department should focus on using historical data to pinpoint the changes that have occurred in the organization. An HRIS can help you keep accurate and consistent employee records and maintain reliable and consistent data. Make sure to standardize fields and naming conventions across systems (e.g., job titles, departments, employment types) so reports are accurate and easy to interpret.
In a small team, you may want to appoint one person in the HR team to be the “data person”, ideally someone with some data literacy who is comfortable with spreadsheets, simple dashboards, or HRIS reporting tools.
Start producing a small set of core reports that give you a clear picture of your workforce. A few useful starting points:
- Headcount report
- Total headcount by department and seniority level
- Breakdown by employment type (e.g., full-time, part-time, contract).
- Turnover report
- Monthly or quarterly exits with reasons by department
- Voluntary vs. involuntary turnover.
- New hire report
- Number of hires per month
- Source of hire, time-to-fill, and new hire attrition (if available).
- Absence report
- Average days lost per employee, by reason (e.g., sick leave, parental leave)
- Patterns across teams or time periods.
Even at this early stage, try to automate recurring reports through your HRIS or spreadsheet templates. That way, you’re not starting from scratch every time, and it’s easier to spot trends.
From Level 1 to Level 2: How to move from operational to advanced reporting
To move beyond basic reporting, the HR team needs to shift from simply tracking what happened to exploring why it happened and how that information can support smarter decisions.
To move from level 1 to level 2, the HR department should proactively create relevant reports around business questions. Don’t just list numbers—analyze trends. For example, is turnover higher in specific departments? Are certain roles taking longer to fill?
Start comparing your data to internal goals or external standards to give your numbers context. Knowing that your turnover rate is 18% is helpful, but knowing that your industry average is 12% tells a clearer story. Also, adding layers to your metrics helps provide more information. Break down data by variables like department, tenure, or seniority. This helps spot patterns you’d miss in high-level totals.
Instead of sending static reports, build visual dashboards that managers and executives can review at a glance. Focus on clarity and relevance, and include only the metrics that support decision-making.
At this level, you may have one or more HR analysts and centralized reporting processes. The goal is to move from describing the past to explaining it, helping leaders take more informed action.
From Level 2 to Level 3: How to move from advanced reporting to advanced analytics
The move from level 2 to level 3 primarily involves using statistical analysis for HR data, such as demographics, performance, and hiring data, combined with financial and operational data from different systems. This enables you to uncover patterns, predict outcomes, and support deeper business questions.
At this stage, it’s important to have a centralized HR (analytics) department and at least some level of data integration of the various systems. Organizations typically use a business intelligence (BI) system to compile data from multiple systems or to build a database or a data warehouse of relevant data that can easily be used for analysis. Statistical tools (e.g., R, Python, or analytics features in platforms like Power BI or Tableau) enable deeper insights, like regression models, clustering, or forecasting.
After collating the necessary data, you can start answering questions through statistical analysis. To ensure strategic impact, focus on key business issues and translate all results into actionable solutions. At this level, the focus is on explaining what’s happening—not just observing it—so the team can identify root causes and guide smarter decisions.
For example, rather than simply noting high turnover in one department, you might analyze historical data to find that mid-level engineers with no promotion in 18+ months and a recent manager change are more likely to resign. These findings allow HR to take informed action, like launching targeted development or retention programs, based on real evidence, not assumptions.
HR tip
While it may be tempting to skip a step on the HR analytics maturity model, or move quickly from one stage to the next, there’s a risk you’ll invest a lot of resources in building something that may need to be redone at a later stage.
From Level 3 to Level 4: How to move from advanced to predictive analytics
The move from level 3 to level 4—the final stage in the HR analytics maturity model—requires a transition to predictive analytics, which enables organizations to forecast future outcomes and model the impact of different decisions. This allows organizations to mitigate risks more effectively and thus engage in strategic workforce planning. Put simply, the goal is to support proactive, forward-looking strategies like workforce planning, succession management, and risk mitigation.
For example, predictive HR analytics can help you:
- Forecast turnover rates over the next 12 months and identify roles or departments most at risk
- Predict internal mobility trends and identify employees who are likely to be ready for promotion
- Anticipate hiring needs based on business growth plans, past attrition patterns, and skill gaps.
To get to this level, you will need additional analytical capabilities in your team, for example, a dedicated data scientist sifting through your people data. As predictive modeling goes beyond simple data analysis, you will begin to use tools that require more programming knowledge. An example of this is R, an open-source system for statistical computation and visualization.
At this stage, HR becomes a true strategic partner by helping the business plan for what’s ahead, not just react to what’s already happened.
Over to you
Understanding the four stages of the HR analytics maturity model and where your organization currently sits can help you better utilize data and analytics to drive performance and success.
Climbing the levels of the model should not be a general goal but rather a tool to serve your business’s needs. If you’re considering investing in greater analytics maturity in your organization, it’s important to map out your needs, demonstrate the value that greater data maturity could yield, and weigh these against the costs.


Learn more
Related articles


Are you ready for the future of HR?
Learn modern and relevant HR skills, online
